“What is productivity in development? I mean, even with metrics like lead time, it might work against taking the time to do good things.”
Julien ‘Seraf’ Syx, CTO & Product Lead, Cycloid
Invisible processes sap energy and resources – not just from people, but also complex systems. Imagine the hidden waste that exists in cloud environments and data centers around the world. KPI metrics like lead time, resource allocation efficiency, deployment frequency, container/cluster use are needed, but are they always measured correctly? And do they tell the whole story?
This brings us to platform engineering, which is at an interesting junction, an inflection point. On one hand, it promises to accelerate time-to-market speed, improve developer experience (DevX), and help break down silos between teams.
On the other hand, DevOps is not dead – but organisations still struggle to this day to deliver on its potential. How can platform engineering answer this call? A good starting point is to understand the KPIs behind platform engineering, and what they mean for the wide ranging stakeholders involved.
So, what represents true productivity in development? First of all, it’s a great question. Because as the quote we opened with suggests, a narrow focus on a specific KPI, in this case lead time, might inadvertently reduce the quality of the code being shipped.
What’s really important in productivity? We need to think about educating and giving developer teams more control over their coding destiny (development workflows), improving speed of deployment and of course, putting security front and center. And putting developers at the center of the KPI discussion is vital. This means your people will understand, use, and can see the value of the new frameworks and best practices platform engineering creates.
Why is a developer centric approach the key to basically everything?
Because a great developer experience (DevX) is a key force behind your competitive edge. And streamlining and automating processes according to best practices helps deliver on this promise, and the experience for developers.
What is a Platform Engineering KPI strategy?
KPIs are without question important. They help us identify success, locate areas to improve, and mark progress towards our overall goals. All these insights are important to the success of platform engineering, and of course, the business in general.
But, and this is a very big but, they should be treated as indicators, and not rigid, immoveable benchmarks. After all, as the quote we led with explains, there are many invisible ‘costs’ in KPIs. In platform engineering for example, yes, your lead time – the time it takes to go from a user story to a deployment – is important. But what if the code you ship quickly breaks all the time? Requires constant management? Creates more support tickets than it solves?
Well then you’ve fallen into the KPI trap.
In this blog, we’ll guide you through 8 fundamental KPIs of Platform Engineering, while helping you understand how to measure for genuine success – and not create a backlog of invisible issues (and support tickets).
Platform Engineering KPIs
According to the 2024 State of DevOps report, some key benefits of adopting Platform Engineering are increased productivity (50%), better quality of software (40%), and reduced time for deployment & more stable applications (both 36%). What we also see is the maturing of platform engineering in organizations, as 43% have had a platform team for 3 – 5 years, and 35% with a team in place for 6 – 10+ years.
The main reasons organizations adopt platform engineering is to speed up product delivery (50%), improve security and compliance (49%), support infrastructure (48%), and build and maintain workflows (47%).
Now, let’s get into the 8 KPIs you need to follow, and why.
KPI Focus: Productivity
Let’s get real – measuring productivity by lines of code written is not only outdated, it is genuinely misleading. The real focus should be helping developers excel at their job by removing roadblocks and reducing dependencies on specialized assistance.
Platform engineering helps here by allowing developers to work with and not against complex infrastructure deployments, creating new environments, shipping features – all of which need DevOps help, which can lead to slowing down processes. Your KPIs should be focused on streamlining and simplifying software delivery processes – creating the best environment for your devs to, well, develop.
-
Lead Time
Lead time tracks the time it takes to go from a user story to the delivery of the request. This covers discussions, backlog, and transition from development to release. If lead times are too high – and this amount of time is something that needs alignment – it shows you have a roadblock somewhere in your processes.
Automate what you can, refine your workflows, find the roadblock/s and see your team’s agile nature bloom – and goals become reachable.
-
Deployment Frequency
Deployment frequency explains how often code is deployed to production, so it can be considered a proxy KPI on the value engineering teams deliver to customers. Deploying frequently shows that your team implements changes quickly and reliably. Deploying less frequently might highlight some issues with your team adopting continuous integration or continuous delivery (CI/CD) practices, or understanding the infrastructure.
-
Developer Happiness
Yes, developer happiness is a key part of productivity. Happy people work better – and this should be no surprise. Platform engineering improves the developer experience (DevX) by reducing cognitive load through providing the right tools and the right environments. So measure your DevX stats, and make happy devs a daily aim for your organization – alongside the other metrics here.
KPI Focus: Stability
As everything becomes more complicated and let’s be honest, over-engineered, stability is foundational to your KPIs. Your product engineers need to make changes confidently and not break things – after all, the end customer experience is paramount.
Stability doesn’t prevent change, but instead means you can innovate rapidly without compromise. Which is really important when considering cloud-native architectures, microservices, and all those dependencies.
-
Change Failure Rate (CFR)
Change failure rate (CFR) shows the percentage of deployments to production that failed, or resulted in bad service or needed remediation. This gives a clear picture of software quality and stability. To calculate this, divide the number of deployments causing failures by the total number of deployments and times by 100.
A high CFR shows friction and risk in your development lifecycle. You also see how much effort you are placing in fixing problems vs releasing new code. Anything over 15% and you’re spending too much time fixing problems compared with releasing. Check your processes!
-
Mean Time to Recover (MTTR)
Mean time to recover (MTTR) tracks how fast service resumes after a production failure or incident. To work this KPI out, look at how long it takes to deploy a patch after the interruption is reported across all outages to find the average.
Even the most resilient systems and best DevOps teams experience downtime and issues – that’s not the problem. The problem comes from being too slow to react and patch. Don’t try to stop failure, but manage it better when it happens.
KPI Focus: Efficiency
Efficiency is the name of the game in 2025. We need to be as efficient and sustainable as possible in using resources. Here we’re looking at cost-efficiency and sustainability metrics, which include the cost in monetary and carbon terms of cloud resources, infrastructure, and licenses, as well as the cost of platform engineering teams.
You need a strategic approach here, and allow for the influence of FinOps – which stands for financial management of the cloud, and GreenOps – which represents sustainable IT, to help you make the right decisions.
-
Resource allocation
Resource allocation in platform engineering is a process of assigning and managing compute, storage, network, and other infrastructure resources, balanced with objectives. Why is it so important in 2025? Simply put, AI and expanding cloud estates.
Platform engineering helps you distribute resources evenly and know exactly where they are spent. Executives will appreciate this metric since it demonstrates whether engineers are focusing on the company’s most crucial goals.
-
Cost observability
Cost observability allows you to gain deep, granular insights into cloud spending patterns. It moves you beyond monthly bills and helps you understand cost drivers, identify inefficiencies, and make data-driven decisions. As resource efficiency is a pillar of platform engineering, we want you to take a sober approach to your cloud consumption.
-
Carbon tracking
Understanding how much carbon your deployments will use is good for the environment and your bottom line. After all, carbon credits exist, are used, and cost money. Datacentres might seem far away from the day to day running of a platform team and the world of software development, but with the advent of AI, how we code and what we use to deliver it has an outsized impact. Reporting structures at national, regional and international level need to be followed. And of course, there is no Planet B, so we need to care about the carbon we produce today, to make sure tomorrow’s future is bright and clear.
Transparent KPIs will help you achieve your goals. Giving end-users and platform teams the ability to see the cost and carbon impact of their architecture designs before deploying, or a holistic overview of all cloud expenses and impacts will be a make-or-break element of your overall success.
And that is worth tracking.
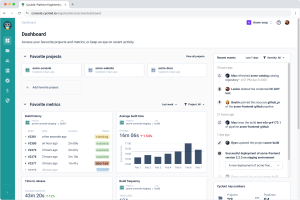
Platform Engineering KPI dashboards
Most of these KPIs have a shared responsibility between teams – keep this in mind when visualizing your metrics. Transparency and observability are two things that help to break down team silos, so shared and comprehensive KPI dashboards are key to the success of your efforts. Here’s what the main KPI dashboard looks like at Cycloid:
And here is what the cloud carbon and cost output dashboard looks like on Cycloid, with easy to view figures for spend and carbon:

What are the key takeaways?
As many platform teams are still struggling with the wider organization’s resistance to platform adoption, tracking your progress needs to be part of your wider KPIs. Why? Because a platform is meant to bring teams together, and benefit the whole company – and this needs cooperation on all sides.
No matter which KPIs you choose, you need to set realistic expectations across the company when starting out with platform adoption. KPIs will evolve as you progress on your Platform Engineering journey. But in the early stages: focus on making it easier for platform and product teams to understand the data and take action.
The bottom line is this: you have the power to control your destiny (and the KPIs)!